For Annotators
#TODO GR Review
Your Dashboard
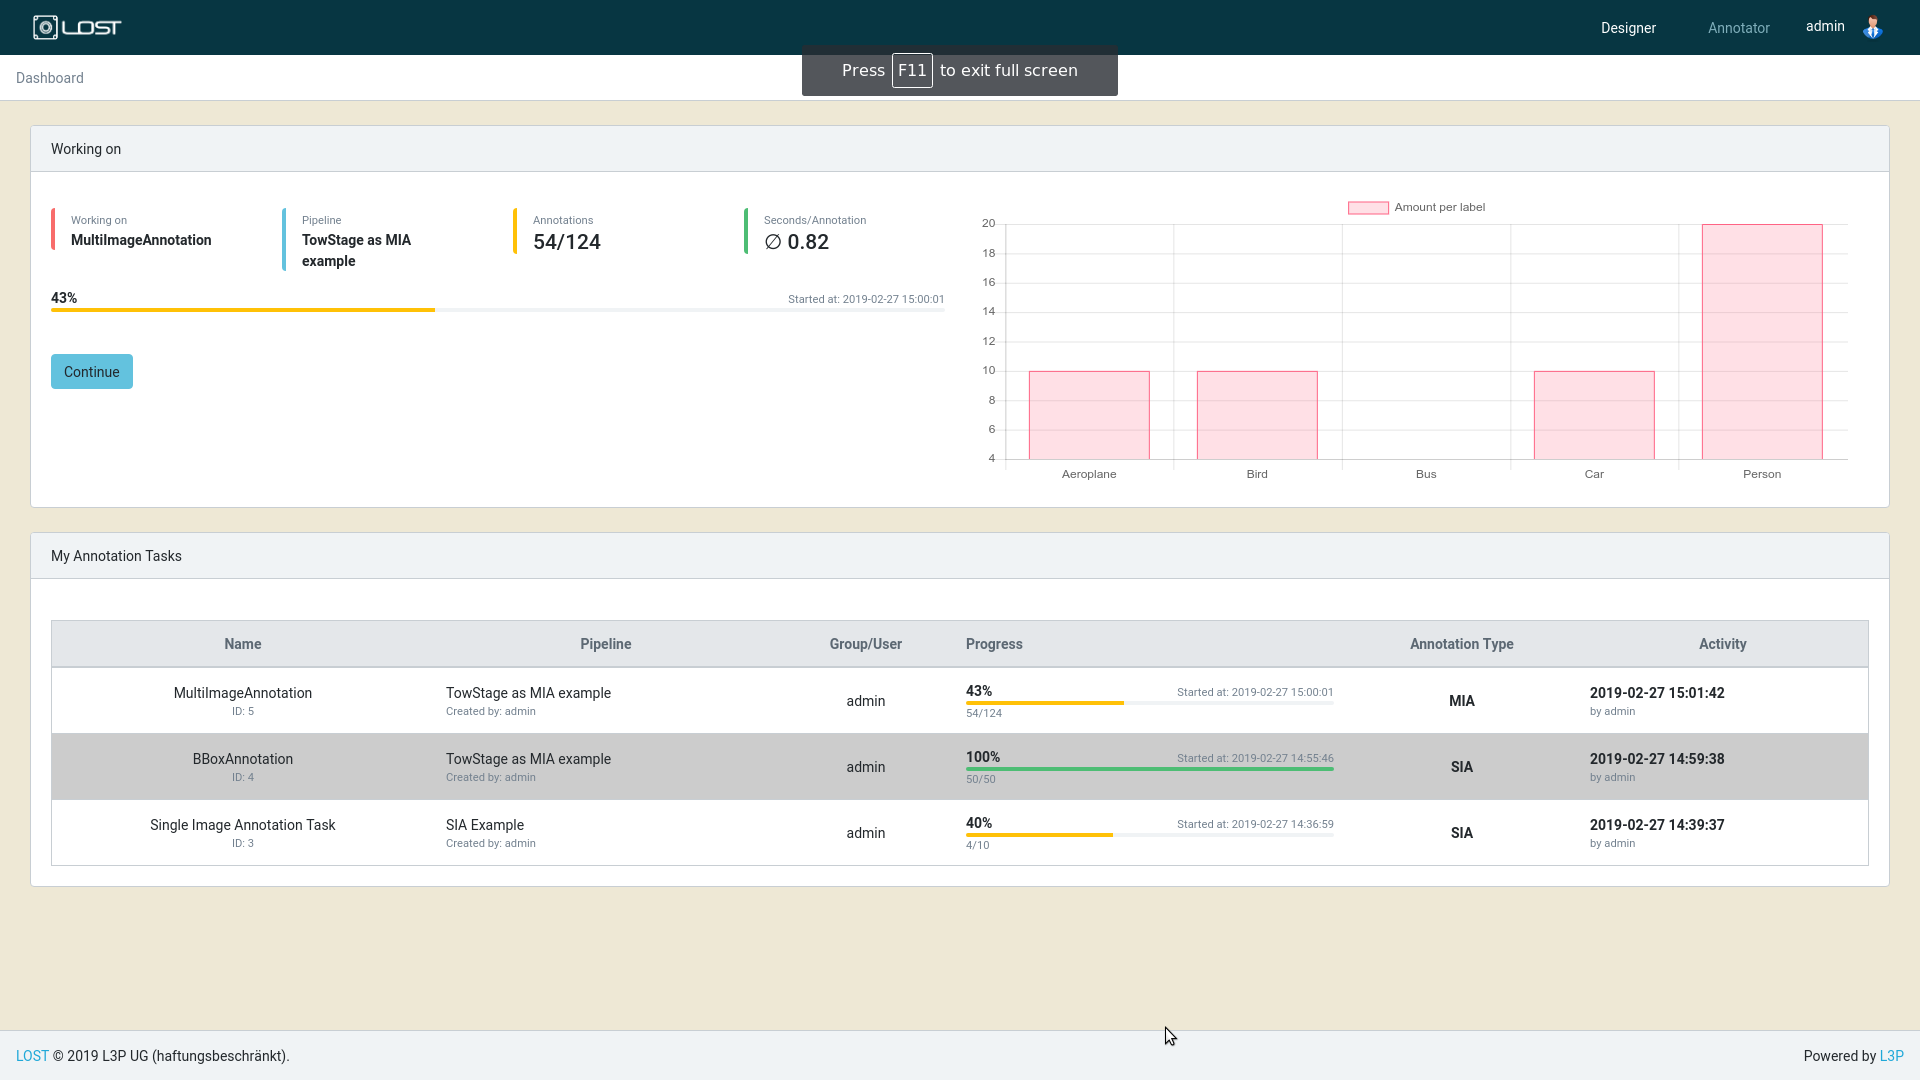
Figure 1: The annotator dashboard.
In Figure 1 you can see an example of the annotator dashboard. At the top, the progress and some statistics of the current selected AnnotationTask are shown.
In the table on the button all available AnnotationTasks are presented. A click on a specific row will direct you to the annotation tool that is required to accomplish the selected AnnotationTask. Rows that have a grey background mark finished tasks and can not be selected to work on.
Getting To Know SIA - A Single Image Annotation Tool
SIA was designed to annotate single images with Points, Lines, Polygons and Boxes. To each of the above mentioned annotations a class label can also be assigned.
Figure 2 shows an example of the SIA tool. At the top you can see a progess bar with some information about the current AnnotationTask. Beyond this bar the actual annotation tool is presented. SIA consists of three main components. These components are the canvas, the image bar and the tool bar
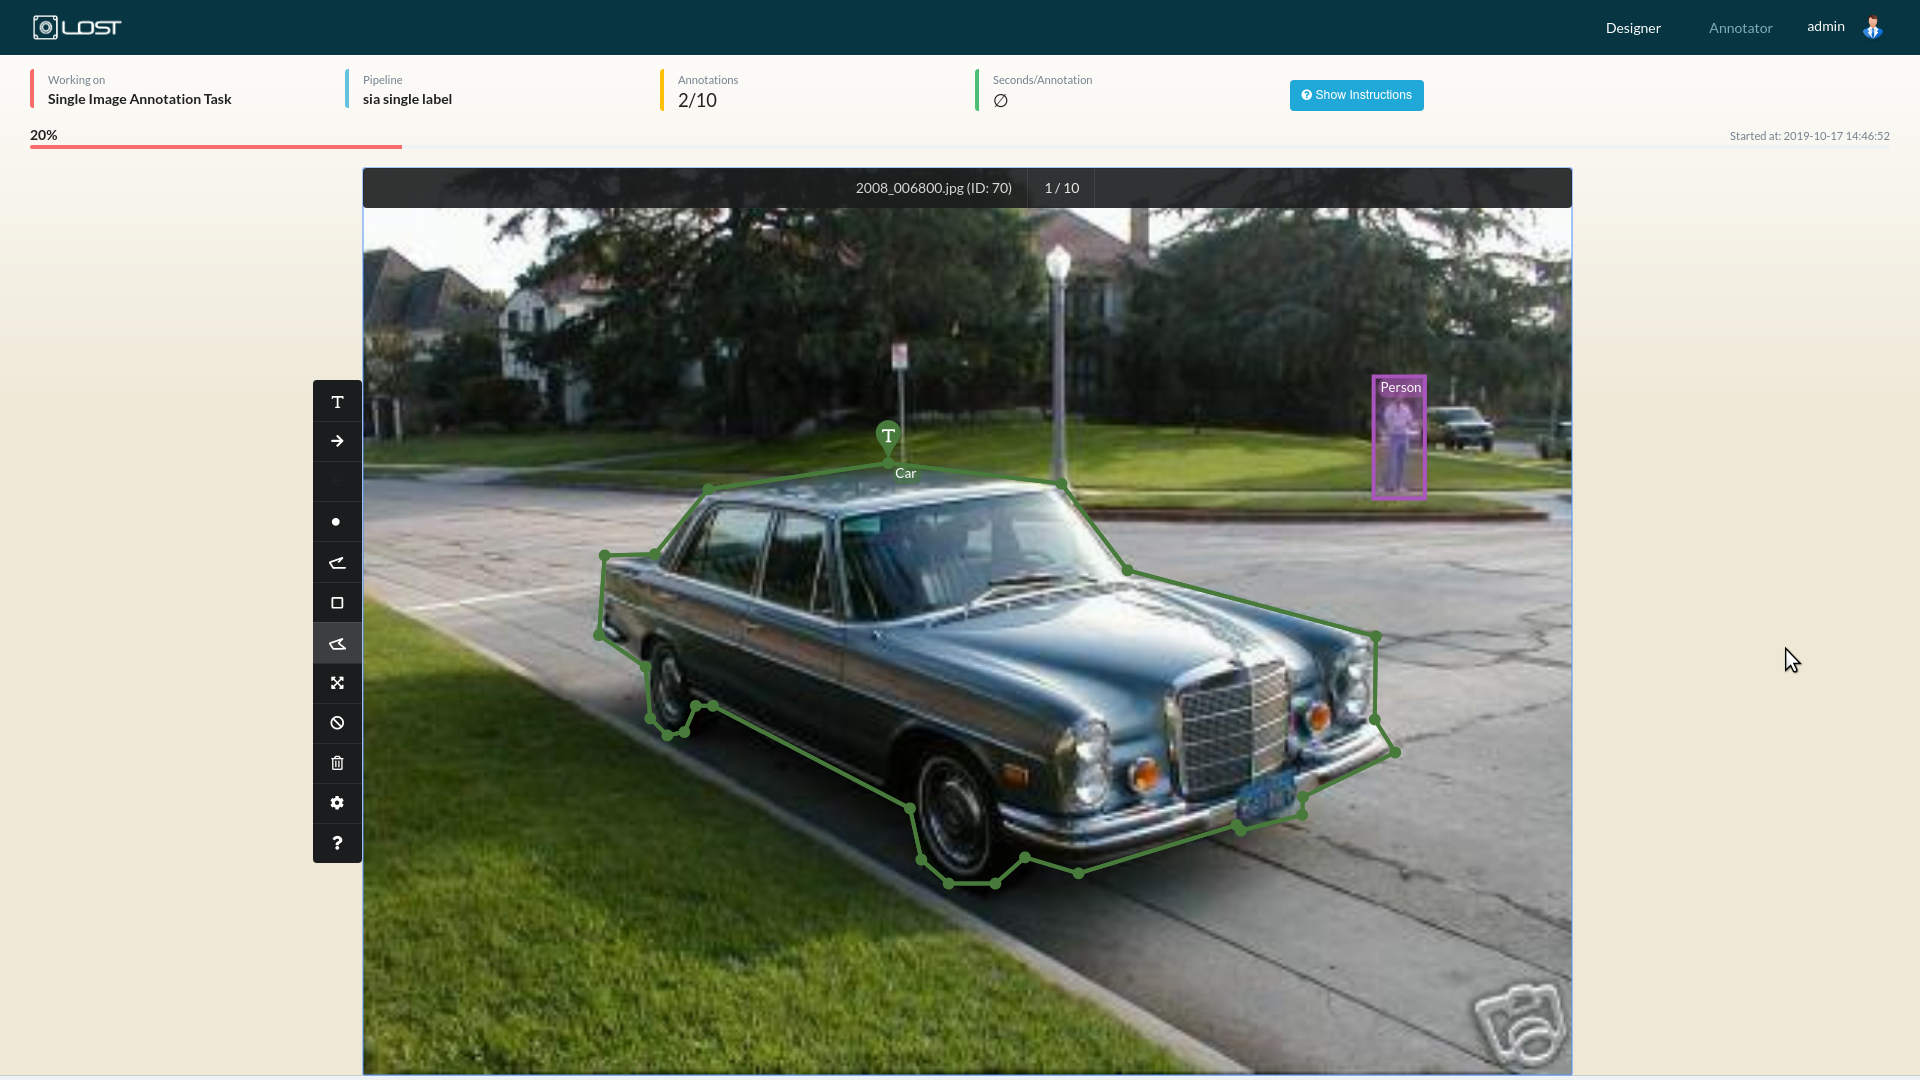
Figure 2: An example of SIA.
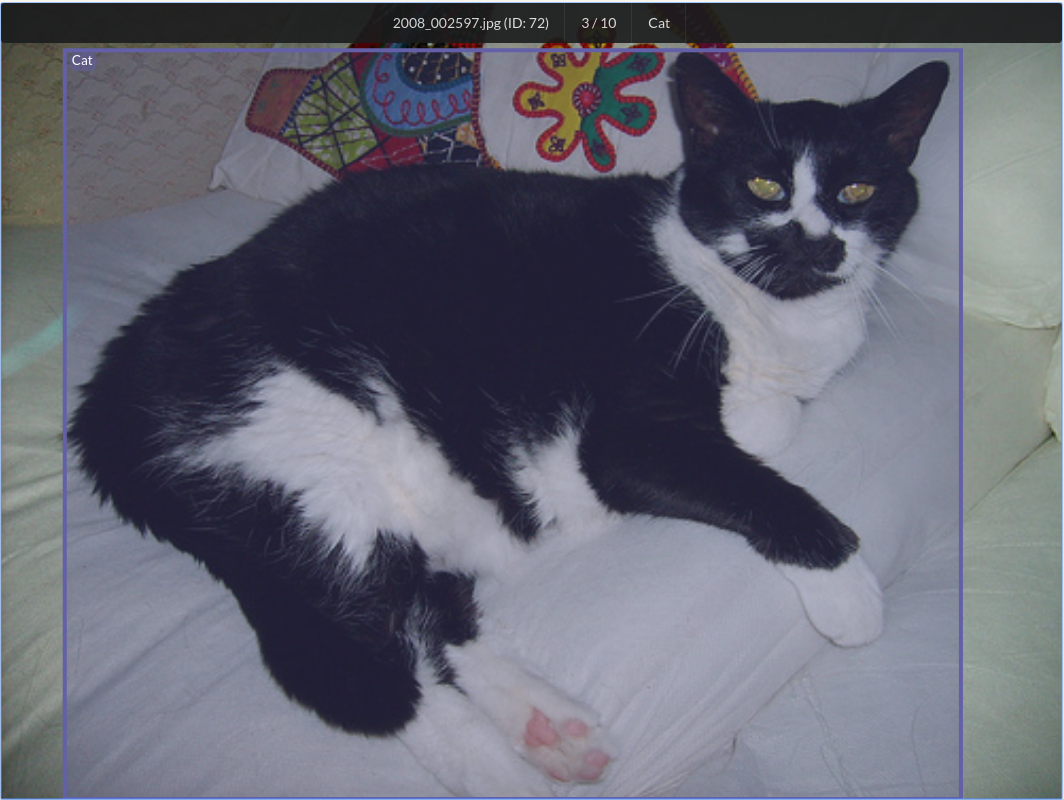
Figure 3: An example of the SIA canvas component. It presents the image to the annotator. By right click, you can draw annotations on the image.

Figure 4: The image bar component provides information about the image. Beginning with the filename of the image and the id of this image in the database. This is followed by the number of the image in the current annotation session and the overall number of images to annotate. The last information is the label that was given to the whole image, if provided.

Figure 5: The toolbar provides a control to assign a label to the whole image. The navigation between images. Buttons to select the annotation tool. A button to toggle the SIA fullscreen mode. A junk button to mark the whole image as junk that should not be considered. A control to delete all annotations in the image. A settings button and a help button.
Warning
There may be also tasks where you can not assign a label to an annotation. The designer of pipeline a can decide that no class labels should be assigned.
Warning
Please note that there may be also tasks where no new annotations can be drawn and where you only can delete or adjust annotations.
Note
Please note that not all tools may be available for all tasks. The designer of a pipeline can decide to allow only specific tools.
Meet MIA - A Multi Image Annotation Tool
MIA was designed to annotate clusters of similar objects or images. The idea here is to speed up the annotation process by assigning a class label to a whole cluster of images. The annotators task is remove images that do not belong to the cluster clicking on these images. When all wrong images are removed, the remaining images get the same label assigned by the annotator.
As an example, in Figure 7 the annotator clicked on the car since it does not belong to the cluster of aeroplanes. Since he clicked on it the car is grayed out. Now the annotator moved on to the label input field and selected Aeroplane as label for the remaining images. Now the annotator needs to click on the Submit button to complete this annotation step.
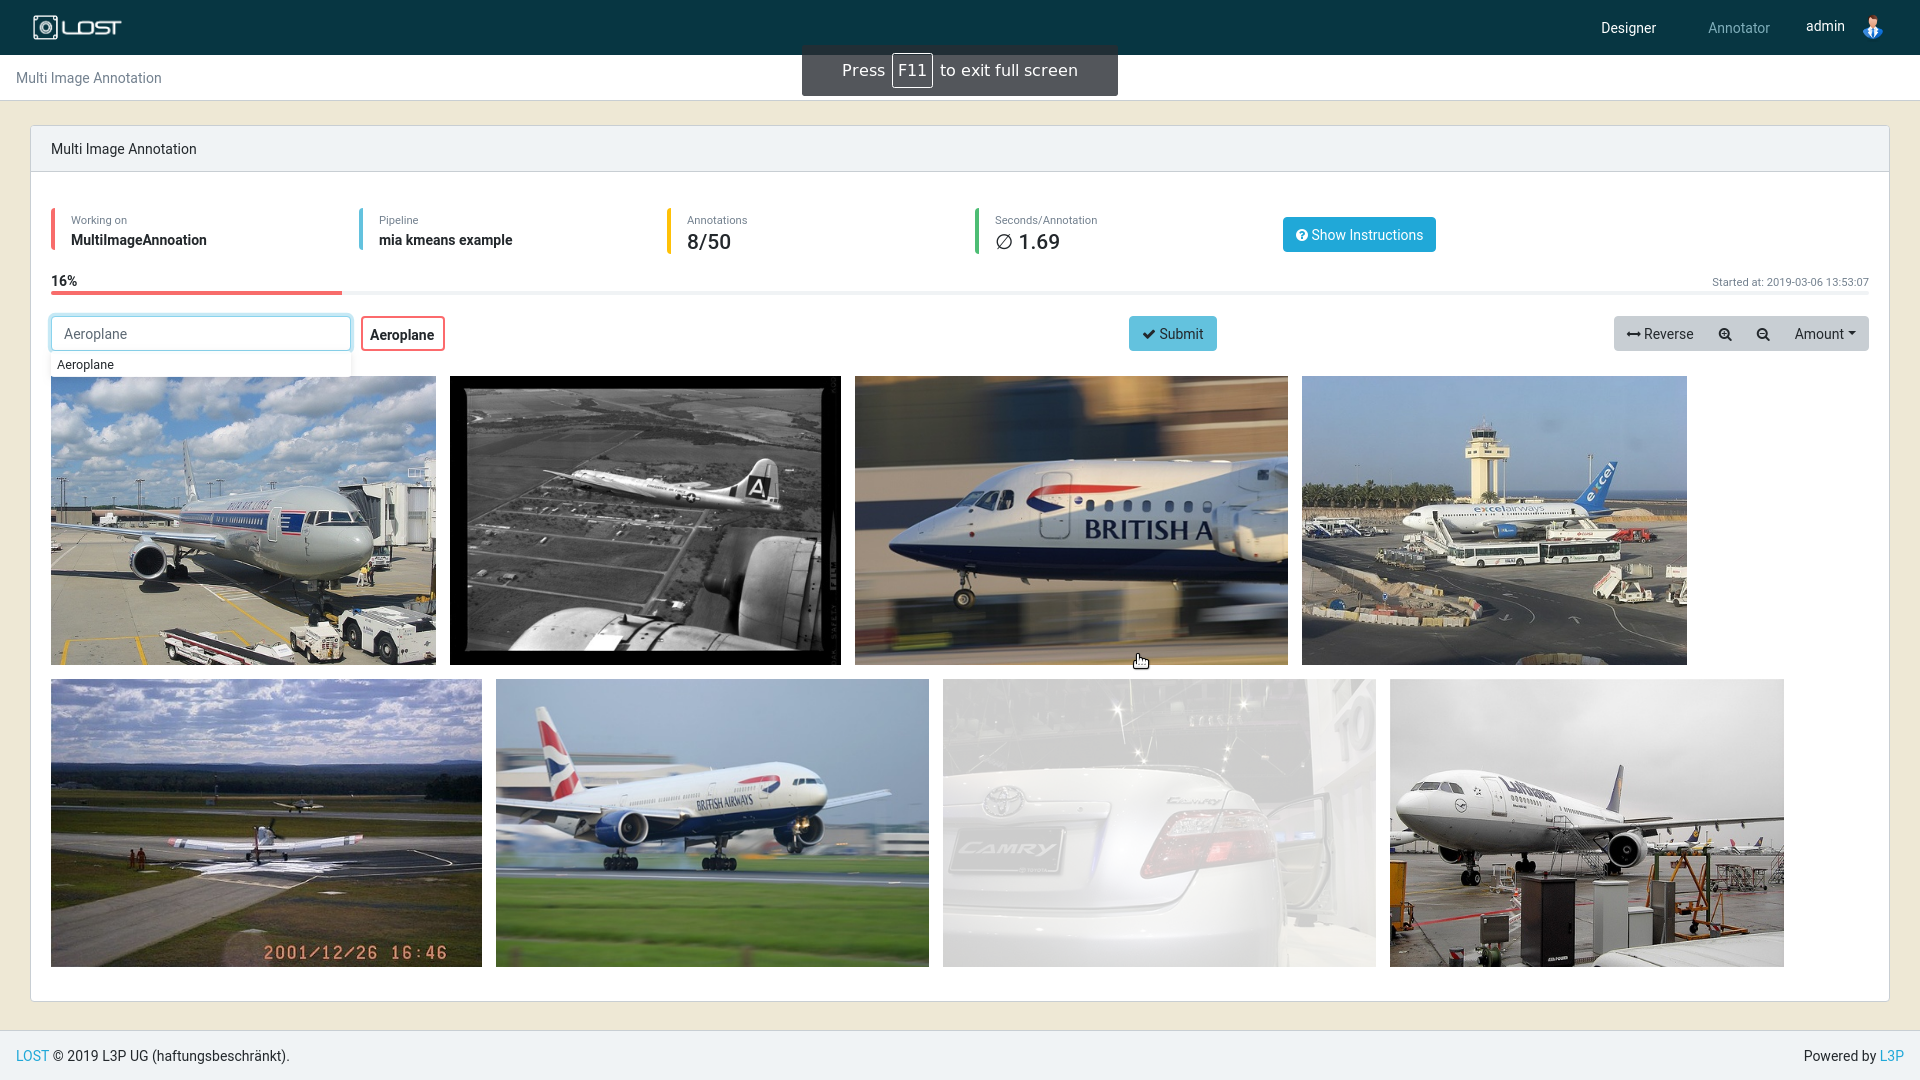
Figure 7: An example of MIA.
Figure 8 shows the left part of the MIA control panel. You can see the label input field and the current selected label in a red box.
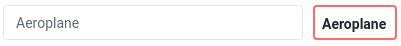
Figure 8: Left part of the MIA control panel.
In Figure 9 the right part of the MIA control panel is presented. The blue submit button on the left can be used to submit the annotations.
On the right part of the figure there is a reverse button to invert your selection. When clicked in the example of Figure 7 the car would be selected for annotation again and all aeroplanes would be grayed out. Next to the reverse button there are two zoom buttons that can be used to scale all presented images simultaneously. Next to the zoom buttons there is a dropdown with name amount here the annotator can select the maximum number of images that are presented at the same time within the cluster view.

Figure 9: Right part of the MIA control panel.
In some cases the annotator may want to have a closer look at a specific image of the cluster. In order to zoom a single image perform a double click on it. Figure 10 shows an example of a single image zoom. To scale the image back to original size, double click again.
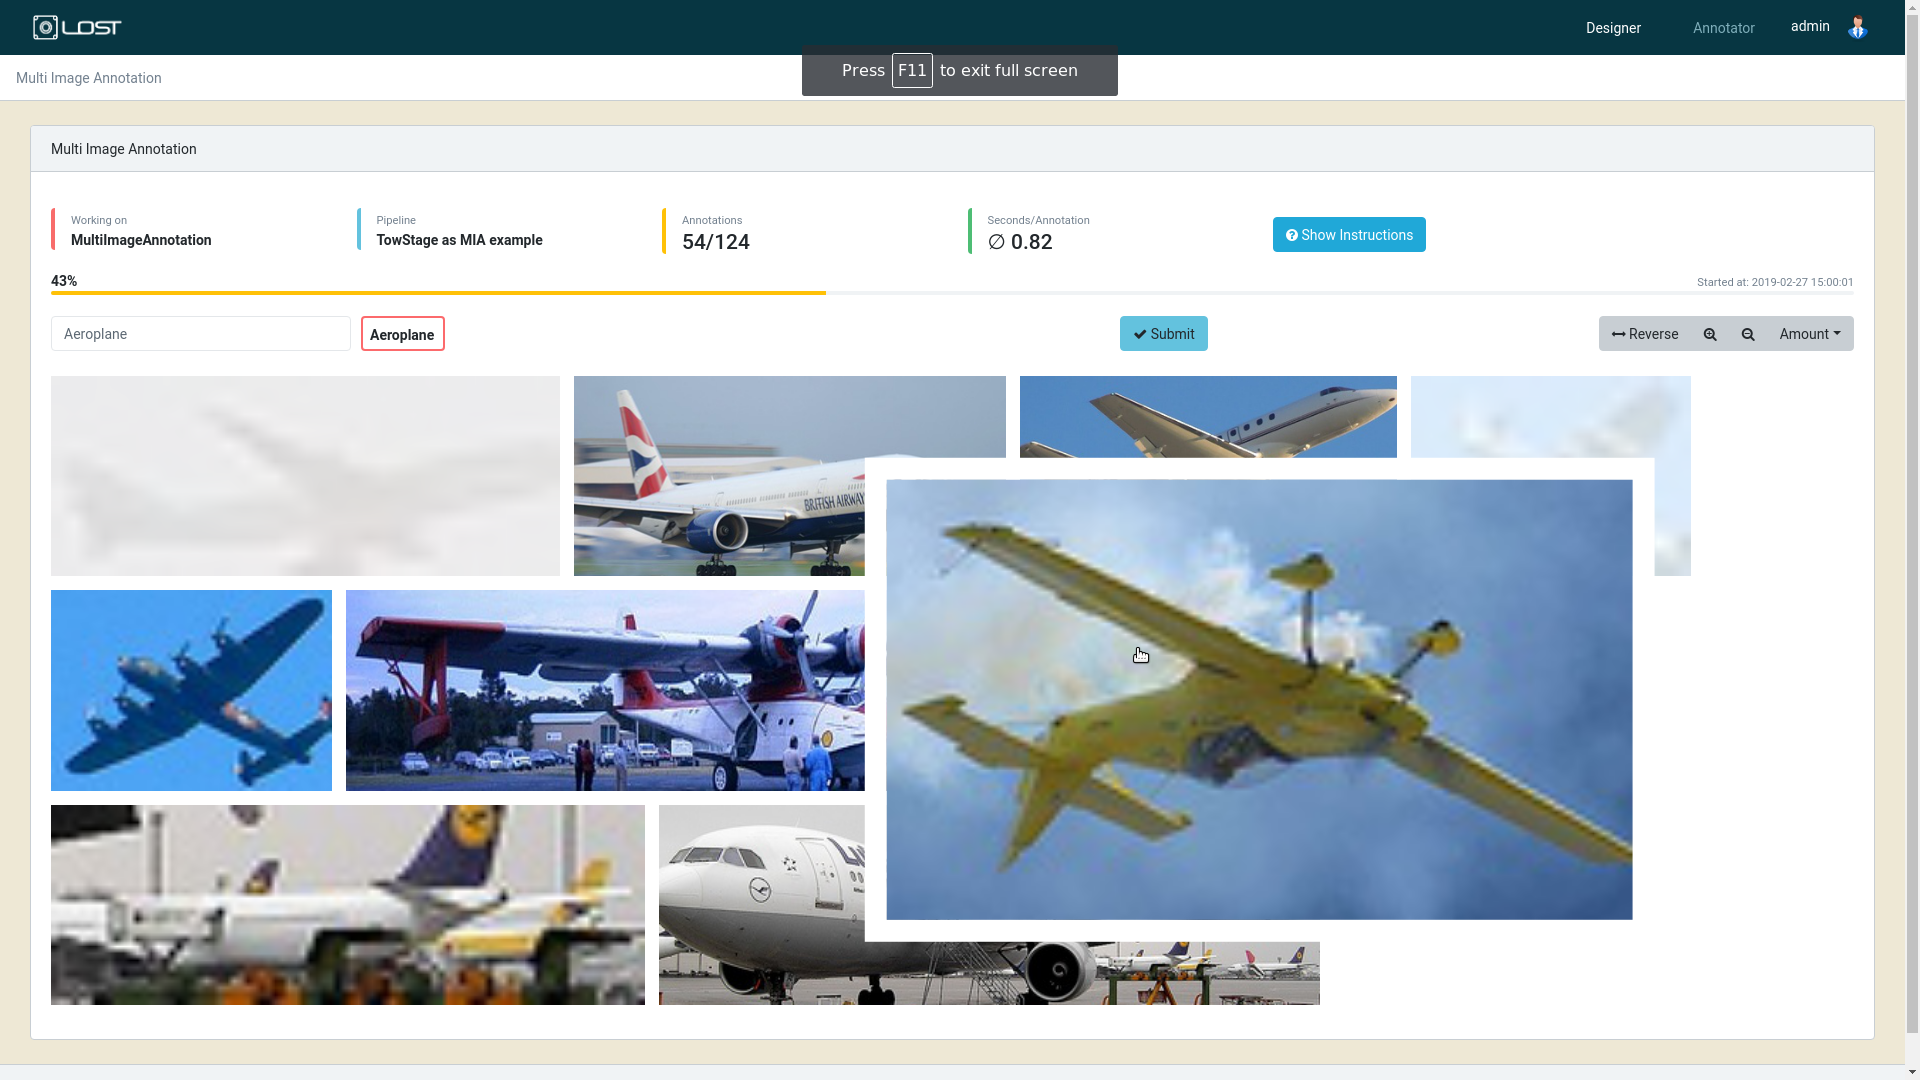
Figure 10: Zoomed view of a specific image of the cluster.